
Building an AWS Reporting Microservice with RDS, Lambda, S3, SES, and QuickSight
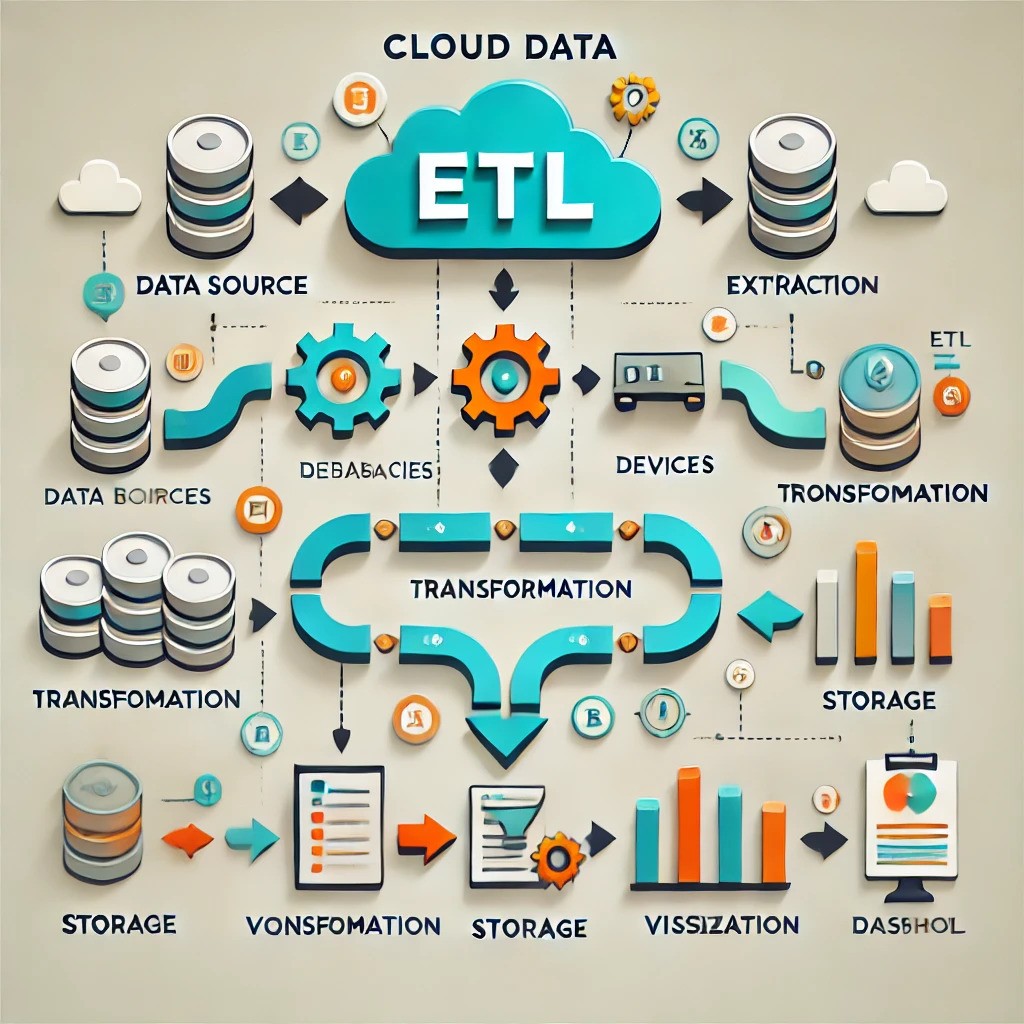
Image courtesy of medium.com
This project outlines a lightweight AWS reporting microservice for teams that need reliable operational reports without manually querying databases or assembling spreadsheets. The system extracts data from Amazon RDS, writes report outputs to S3, sends scheduled email summaries through SES, and supports dashboarding through QuickSight.
Table of Contents
Problem
Business teams often need detailed, recurring reports from production or analytics databases. The common fallback is manual SQL extraction, spreadsheet assembly, and ad hoc email delivery. That process is fragile: it creates inconsistent reporting logic, depends on individual analysts, and does not scale well as reporting needs grow.
The goal of this system is to automate recurring reports while keeping the architecture simple enough for a small team to maintain.
Technical Challenges
A useful reporting pipeline needs to handle several practical constraints:
- Querying relational data without overloading the source database.
- Producing repeatable report outputs on a schedule.
- Storing generated files in a durable location.
- Delivering reports to business stakeholders without manual intervention.
- Supporting dashboard exploration when a static CSV is not enough.
Architecture
The core architecture uses the following AWS services:
- Amazon RDS as the relational data source.
- AWS Lambda to run scheduled extraction and transformation logic.
- Amazon CloudWatch / EventBridge to trigger the workflow on a recurring schedule.
- Amazon S3 to store generated CSV outputs.
- Amazon SES to send email reports and attachments.
- Amazon QuickSight to visualize report outputs and expose dashboards.
Implementation Steps
Step 1: Configure Amazon RDS
The RDS instance stores the source data used for reporting. The reporting queries should be designed carefully so they retrieve the necessary data without creating unnecessary load on production systems. In many cases, a read replica or analytics database is preferable to querying production directly.
Step 2: Schedule Lambda with CloudWatch or EventBridge
A scheduled rule triggers a Lambda function at the required reporting cadence, such as daily or weekly. The Lambda function contains the extraction logic, database connection configuration, and output formatting steps.
Step 3: Query RDS and Write Results to S3
The Lambda function connects to RDS, executes the report query, formats the result as a CSV, and writes the file to an S3 bucket. S3 provides a durable archive of generated reports and gives downstream tools a stable location from which to read files.
Step 4: Send Reports with SES
After the file is written to S3, the Lambda function can send a summary email through SES. Depending on file size and stakeholder needs, the email can include an attachment, a pre-signed S3 link, or a short summary with dashboard links.
Step 5: Visualize Outputs in QuickSight
QuickSight can read from S3 or related AWS data sources to create dashboards from the generated report data. This gives stakeholders a more interactive option when they need to filter, drill down, or compare trends over time.
Deliverable
The result is a scheduled reporting pipeline that produces repeatable outputs, stores them in S3, and sends stakeholders the relevant files or summaries without requiring manual analyst work each cycle.
Tradeoffs and Lessons
This architecture is useful when the reporting workload is clear, bounded, and not large enough to justify a heavier orchestration layer. For more complex data pipelines, I would consider Glue, Step Functions, dbt, or a warehouse-native workflow. The main lesson is that small cloud-native components can remove a large amount of manual reporting work when the scope is well defined.